If you want to know how an F1 driver or team fared in pre-season testing, then you could do a lot worse than checking the number of laps they have clocked up compared to their rivals.
Drivers tend to cover the most mileage in sessions that run smoothly, with reliable cars and efficient, planned work in the garage. In contrast, when things go wrong, the lap count can plummet.
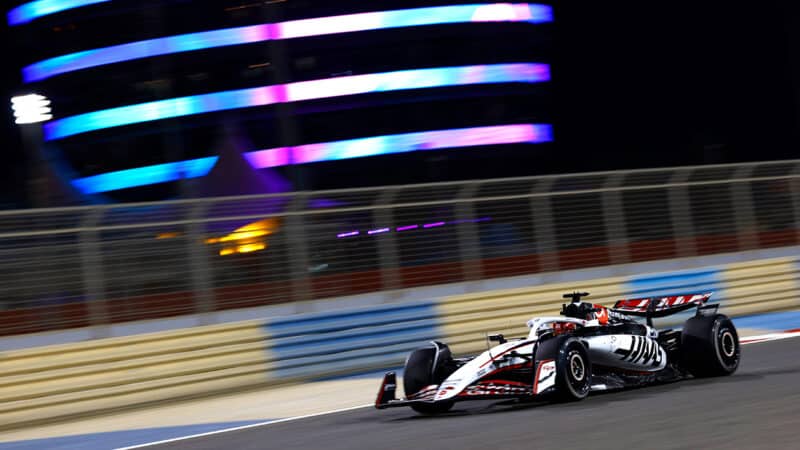
Just one glance at the tables below shows how efficiently Esteban Ocon’s sessions went in the Haas, courtesy of his unbeaten 260 lap total over the course of the three days,.
At the other end of the chart, Lance Stroll’s illness that curtailed his final session has put him at the bottom, below the Red Bull drivers who spent a significant time in the pits.
The close competition should be evident when you look at the distance eash team covered — the top three are separated by just four laps.
Any data from F1 pre-season testing can be misleading and should be taken with a pinch of salt, but a team with a high lap count and a respectable showing on the time-sheet starts to look promising for the grands prix ahead.
With that in mind, we’ve listed below the total lap counts for each driver, team and power unit from 2025 F1 testing.
Laps completed by each driver in 2025 F1 pre-season testing
Esteban Ocon’s heroic final afternoon, where he covered 103 laps, push him to the top of the table, overtaking Isack Hadjar who had led previously.
Both Red Bull drivers sit at the bottom of the table: above only Lance Stroll, whose Friday session ended early due to illness.
|
Driver |
Team |
Laps |
| 1 |
Esteban Ocon |
Haas |
260 |
| 2 |
Isack Hadjar |
Racing Bulls |
243 |
| 3 |
George Russell |
Mercedes |
232 |
| 4 |
Kimi Antonelli |
Mercedes |
226 |
| 5 |
Charles Leclerc |
Ferrari |
220 |
| 6 |
Yuki Tsunoda |
Racing Bulls |
211 |
| 7 |
Jack Doohan |
Alpine |
209 |
| 8 |
Alexander Albon |
Williams |
200 |
| 9 |
Ollie Bearman |
Haas |
197 |
| 10 |
Pierre Gasly |
Alpine |
196 |
| 11 |
Oscar Piastri |
McLaren |
195 |
| 12 |
Carlos Sainz |
Williams |
195 |
| 13 |
Lando Norris |
McLaren |
186 |
| 14 |
Nico Hulkenberg |
Sauber |
180 |
| 15 |
Gabriel Bortoleto |
Sauber |
174 |
| 16 |
Fernando Alonso |
Aston Martin |
173 |
| 17 |
Lewis Hamilton |
Ferrari |
162 |
| 18 |
Max Verstappen |
Red Bull |
155 |
| 19 |
Liam Lawson |
Red Bull |
149 |
| 20 |
Lance Stroll |
Aston Martin |
133 |
Laps completed by each team in 2025 F1 pre-season testing
Here’s where car troubles can become more apparent as we combine the laps completed by both drivers per team. After three days, the top three teams are split by just four laps.
|
Team |
Laps |
| 1 |
Mercedes |
458 |
| 2 |
Haas |
457 |
| 3 |
Racing Bulls |
454 |
| 4 |
Alpine |
405 |
| 5 |
Williams |
395 |
| 6 |
Ferrari |
382 |
| 7 |
McLaren |
381 |
| 8 |
Sauber |
354 |
| 9 |
Aston Martin |
306 |
| 10 |
Red Bull |
304 |
Laps completed by each power unit in 2025 F1 pre-season testing
Four cars are running Mercedes engines, but only one is powered by Renault, so in addition to the total laps completed by each power unit, we’ve calculated the average per car for comparison.
|
Power unit |
Laps |
Average laps per car |
| 1 |
Mercedes |
1540 |
385 |
| 2 |
Ferrari |
1193 |
398 |
| 3 |
Honda |
758 |
379 |
| 4 |
Renault |
405 |
405 |
