MPH: The surprise findings when you compare F1 team-mates' qualifying times

F1

Look beyond the head-to-head qualifying results between F1 team-mates, and a different picture emerges around which drivers are closely matched, writes Mark Hughes

George Russell with Lewis Hamilton at 2024 Bahrain GP testing

The head-to-head qualifying record of Hamilton and Russell isn't as clear as it appears

Kym Illman/Getty Images

Mark Hughes
Head-to-head team-mate qualifying score (comparable sessions) Time gap
Verstappen 13 0 Perez 0.568% (0.486sec)
Bottas 11 1 Zhou 0.471% (0.403sec)
Albon 8 1 Sargeant 0.300% (0.257sec)
Alonso 12 3 Stroll 0.233% (0.199sec)
Hulkenberg 10 5 Magnussen 0.187% (0.159sec)
Norris 9 4 Piastri 0.142% (0.121sec)
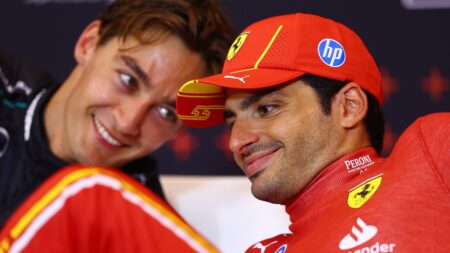
Russell 11 4 Hamilton 0.115% (0.098sec)
Tsunoda 10 5 Ricciardo 0.095% (0.081sec)
Ocon 8 4 Gasly 0.074% (0.063sec)
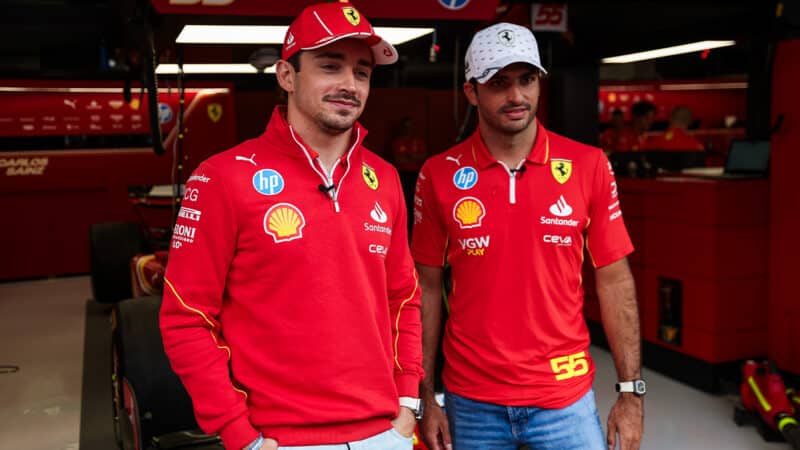
Leclerc 9 6 Sainz 0.047% (0.040sec)


Above are the average qualifying comparisons of each set of team-mates after Hungary last weekend (round 13 of 24, so just over half-way through). They are arranged from the biggest time gap down to the smallest.

They are taken only from sessions where a fair comparison has been feasible (hence the different totals). If there is a car spec difference (as has been the case for many races this year with Williams, for example) it has not been counted as a valid comparison. When a driver makes it through to the next stage of qualifying but his team-mate is knocked out, only the session in which they both took part is counted, so as to mitigate increased track grip in the later session. Similarly if the session was wet (far too random a track grip difference according to when you cross the line to begin your lap) it’s not counted. Any driver obviously not setting a representative time (either through a crash or being baulked, for example) also invalidates the comparison.

The gaps are listed first as a percentage so that the varying lap lengths of the tracks do not skew the comparison. Those percentages are then converted into the times you see in brackets by applying them to the average fastest qualifying time (not always pole) across the 13 circuits. The sprint qualifying sessions have been included (where appropriate, i.e. not the wet ones).

Charles Leclerc and Carlos Sainz

F1’s closest-matched team-mates

Ferrari

It’s not perfect but it takes as many of the potentially skewing factors out as possible. There are a few stand-out numbers which may not equate to general perceptions. Would you have guessed that Ferrari’s Leclerc/Sainz are the most closely-matched pairing on the grid with a tiny four-hundredths of a second average separating them?

All four of the most closely-matched set of team mates are separated by less than a tenth of a second – and they include Russell/Hamilton at Mercedes and Tsunoda/Ricciardo at RB. That goes against perceptions in each case because of the number of times Russell and Tsunoda have out-qualified their respective team mates. But although Hamilton and Ricciardo have less often been faster, when they have been so it has tended to be by a bigger margin.

Related article

It’s probably not a surprise that the biggest margin is that between Max Verstappen and Sergio Perez at Red Bull, but more than double that between Fernando Alonso and Lance Stroll at Aston?

Obviously team-mate comparisons cannot tell us much about how drivers from different teams compare. It’s a competition between both cars and drivers. Historically there has been a bigger difference between cars than drivers. Despite how much the field has closed up in the last couple of years, that’s probably still the case. The gap between the fastest qualifying team (Red Bull) and the slowest (Sauber) is around 1.5sec. Obviously, there’s a certain circularity in that measure as Verstappen is almost certainly a faster driver than Valtteri Bottas. But not by anything like 1.5sec. Even – for the sake of argument – we put Bottas on a par with Perez (and I’d have bet my house on Bottas over Perez on a qualifying lap any time in the last eight seasons), the gap between the cars is three times as big as the biggest gap between team-mates.

Here is the order of average qualifying performance for each car. A theoretical pole (i.e. the average of the fastest qualifying times from each track would be 1min 25.535sec). From that we get:

Constructor Average qualifying time
1 Red Bull 1min 25.623sec
2 McLaren 1min 25.803sec
3 Ferrari 1min 25.948sec
4 Mercedes 1min 26.052sec
5 Aston Martin 1min 26.411sec
6 RB 1min 26.539sec
7 Haas 1min 26.645sec
8 Alpine 1min 26.851sec
9 Williams 1min 26.977sec
10 Sauber 1min 27.147sec


So the car is still dominant. But the intriguing question to ponder is in cases where the speed between cars is extremely close, how much difference is the driver making? Red Bull has an average of 0.15sec over McLaren so far. Is that the difference of Verstappen over Lando Norris? Would those positions be reversed if the drivers were swapped? Or is Norris actually flattering the McLaren? There’s only 0.2sec between Aston, RB and Haas. Who’s the quickest of those teams’ lead drivers? Alonso, Tsunoda or Hulkenberg? Is Albon faster or slower than Ocon? Is Bottas still as fast as when in his best year he was within a 0.15sec of Hamilton at Mercedes?

The fact that we don’t definitively know the answers to these questions – and the even more intriguing probability that the answers are changing all the time – is actually at the heart of the sport’s fascination.