“At the end of the first day, a hazy pattern is present,” said the team. “By the end of the first test, that pattern comes into better focus.”
It’s not quite a data-driven crystal ball, however, with Mercedes describing its leaderboard as “lower-bound estimates”.
You can say with some confidence that your competitors are “at least as fast as X”, but you do not know for sure how much faster they could have gone,” it says. “No-one wants the egg on their face, claiming that they are faster than another team, because they can never know for certain what was hidden or what is coming next.
“For example, will Red Bull bring a significant upgrade package to the second test? Why have Ferrari spent this test running their power unit consistently at much lower levels than their partner teams?”
Despite the caveats, Mercedes did make some predictions about the start of the season, suggesting that its new dual-axis steering system may not give it a significant advantage in Australia, at least. “The battle in Melbourne at the front is going to be tight,” it said. “We can also see that the midfield have closed on the front and that there is some considerable midfield swing compared to last year’s competitive order.”
Testing spy: how Mercedes calculates its rivals’ true pace
“Testing times are not meaningless,” says Mercedes. “They are a goldmine, if you’re prepared to sift through them with care and caution until a clear picture begins to emerge. If you look at them long enough, they gradually give up their secrets.”
This is how the team analyses the performance of its rivals:
Start with what you know
Teams know every car’s lap time and the number of laps completed, as well as the performance difference between tyre compounds and the amount of fuel that’s burnt each lap.
Like a Maths GCSE question, you can start to estimate a car’s pace from this data.
Look what happened last year
In the top secret world of F1 car development, teams are surprisingly predictable when it comes to their testing runs. “They tend to do similar things each year,” says Mercedes. “Most people will run three fuel levels: a lower fuel load for performance, a medium fuel load for the bulk of their work, and full tanks for their race simulations. For each team, these three levels are different, but, weirdly, they don’t vary much from year to year.
“Our opening guesses will assume that each team will do the same as they did the year before.”

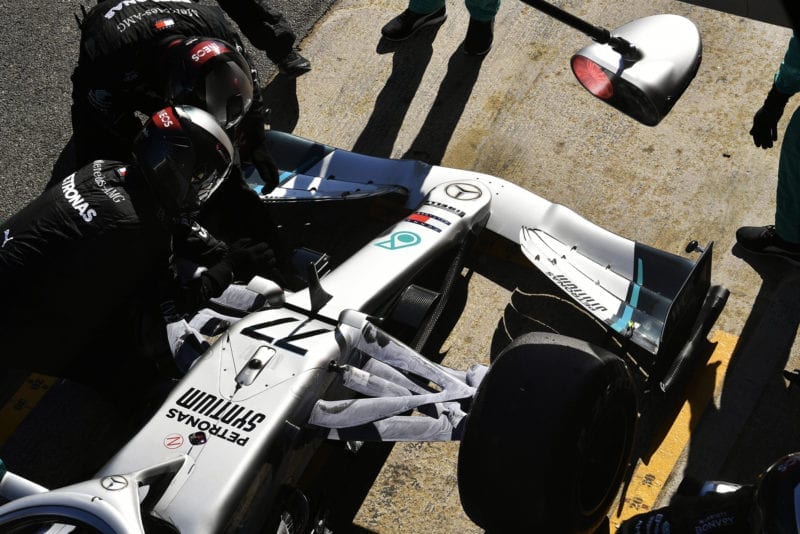
Pit stops are a good sign that a team is on a race simulation
Motorsport Images
Count the laps
To refine the opening guesses, strategists look at the number of laps that a car has run, and identify the minimum fuel load. “If a car does a 10 lap run, then we know that a lap consumes (say) 1.7kg, then there must have been at least 17kg of fuel in the car to do that run,” says Mercedes. “In reality, teams do not like to run down to fumes in normal testing, so it is more likely that there was at least 27kg of fuel in the car.
“If our prior assumption was that this team normally runs 50kg for general testing, then we will adjust our initial guess to say that the car was likely to have somewhere between 27kg and 50kg of fuel in the car. Once a team has done a load of running, this estimate gets surprisingly accurate.”
Watch for the pit stops
“The real insight comes when a team attempts a race distance. Doing a full race distance with pit-stop style tyre changes implies that the team must have its tanks near to full. This narrows the error in our estimates dramatically, allowing race times to be compared more or less directly.”
Tracking data
GPS tracking allows teams to see rivals’ speed and acceleration, which allows them to calculate each engine’s power and available modes.


