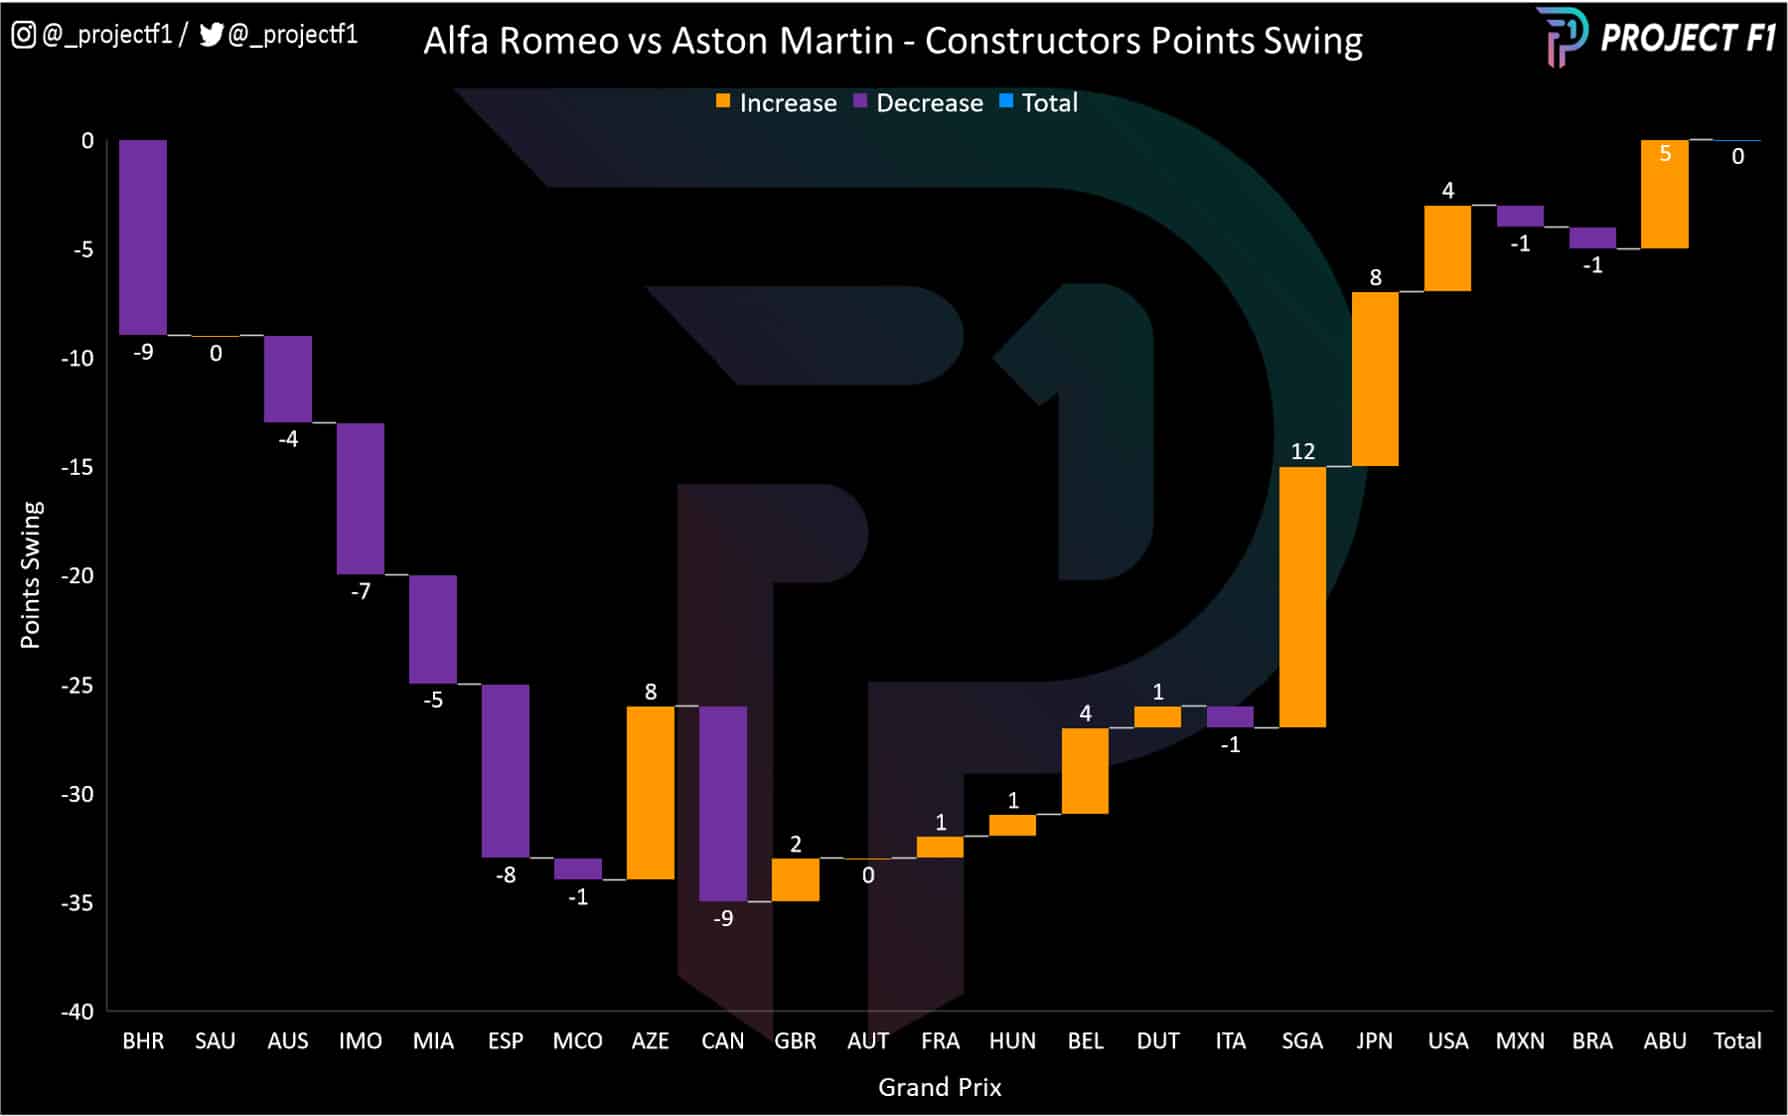
The purple bars indicate races where Alfa increased its margin over its rival, while the orange bars are the races where Aston clawed back some of the deficit.
After six races, it had just six points. The team was also hampered by Sebastian Vettel missing the first two races of the season as a result of Covid.
Replacement driver Nico Hülkenberg struggled to adapt to the new car, having been out of the sport for some time, and Vettel was also on the back foot when he returned, having covered minimal mileage in the new car.
But as redesigned sidepods and a weight reduction started to have an impact, from the eighth race in Azerbaijan, the trend began to change. The chart shows how this was a season of two halves, with Aston gaining eight points on Alfa in Baku. After a qualifying disaster in Canada, the team gathered momentum, powered by a strong set of results from Sebastian Vettel.
Towards the end it was tit-for-tat but a poor strategy for Vettel in Abu Dhabi proved decisive, as the Aston driver failed to get the one additional point: a farewell gift that would have moved the team up to sixth in the championship and earned an extra $10-$12m in prize money.
F1 veterans show their worth
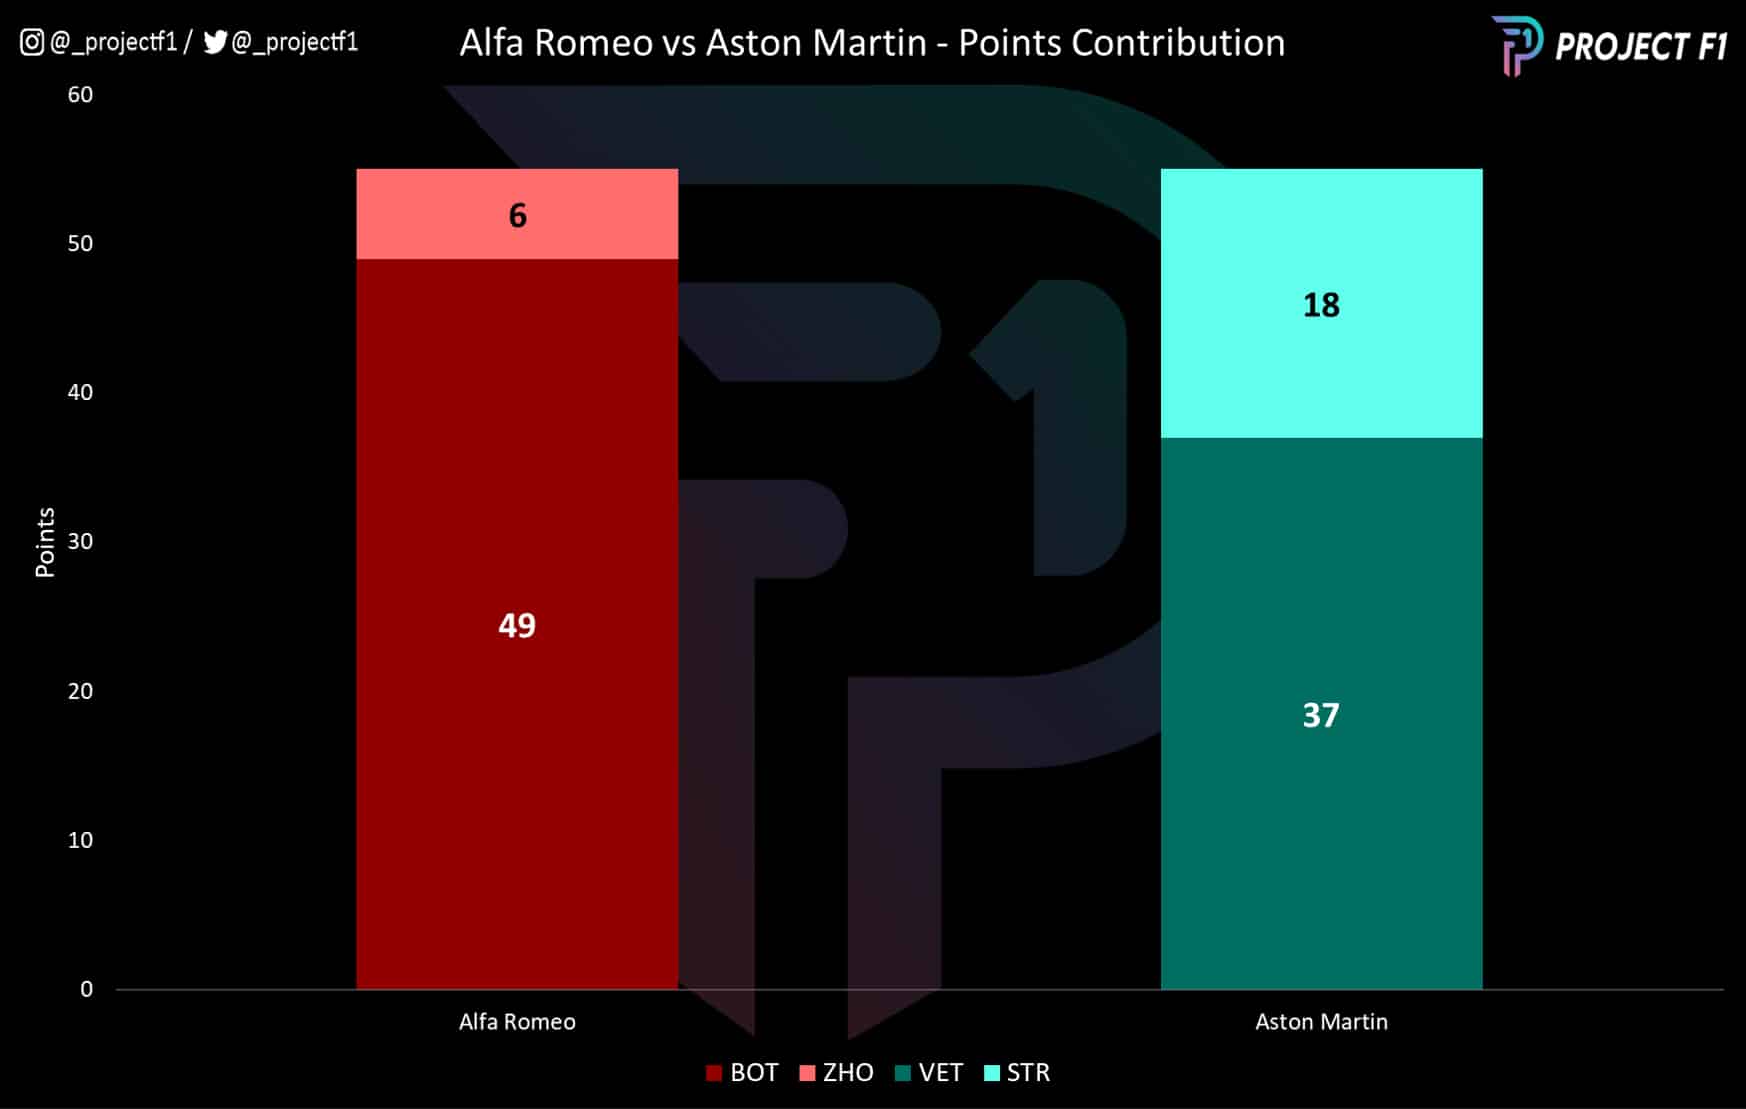
Chart 2 Points contribution
There was sniping that Fernando Alonso’s arrival at Aston Martin for 2023 is as much due to his commercial pull as it is his driving, but the evidence from last season suggests that he’s just the driver that the team needs.
Chart 2 breaks down the points contribution from each driver and could easily serve as an advertisement for the value of experience. Senior drivers Bottas and Vettel provided the lion’s share of their team’s points, with Bottas in particular delivering the goods.
That’s not a fully accurate reflection on last year’s Alfa rookie Zhou Guanyu who was, on several occasions, on course for a strong result when a mechanical issue intervened.
Lance Stroll had better representation in the points tally than Zhou but still fell short of his team-mate. While Stroll was getting points regularly, they were often toward the lower end of the top 10. This was not the case for Vettel who was more frequently found higher up the order
Compensating for qualifying
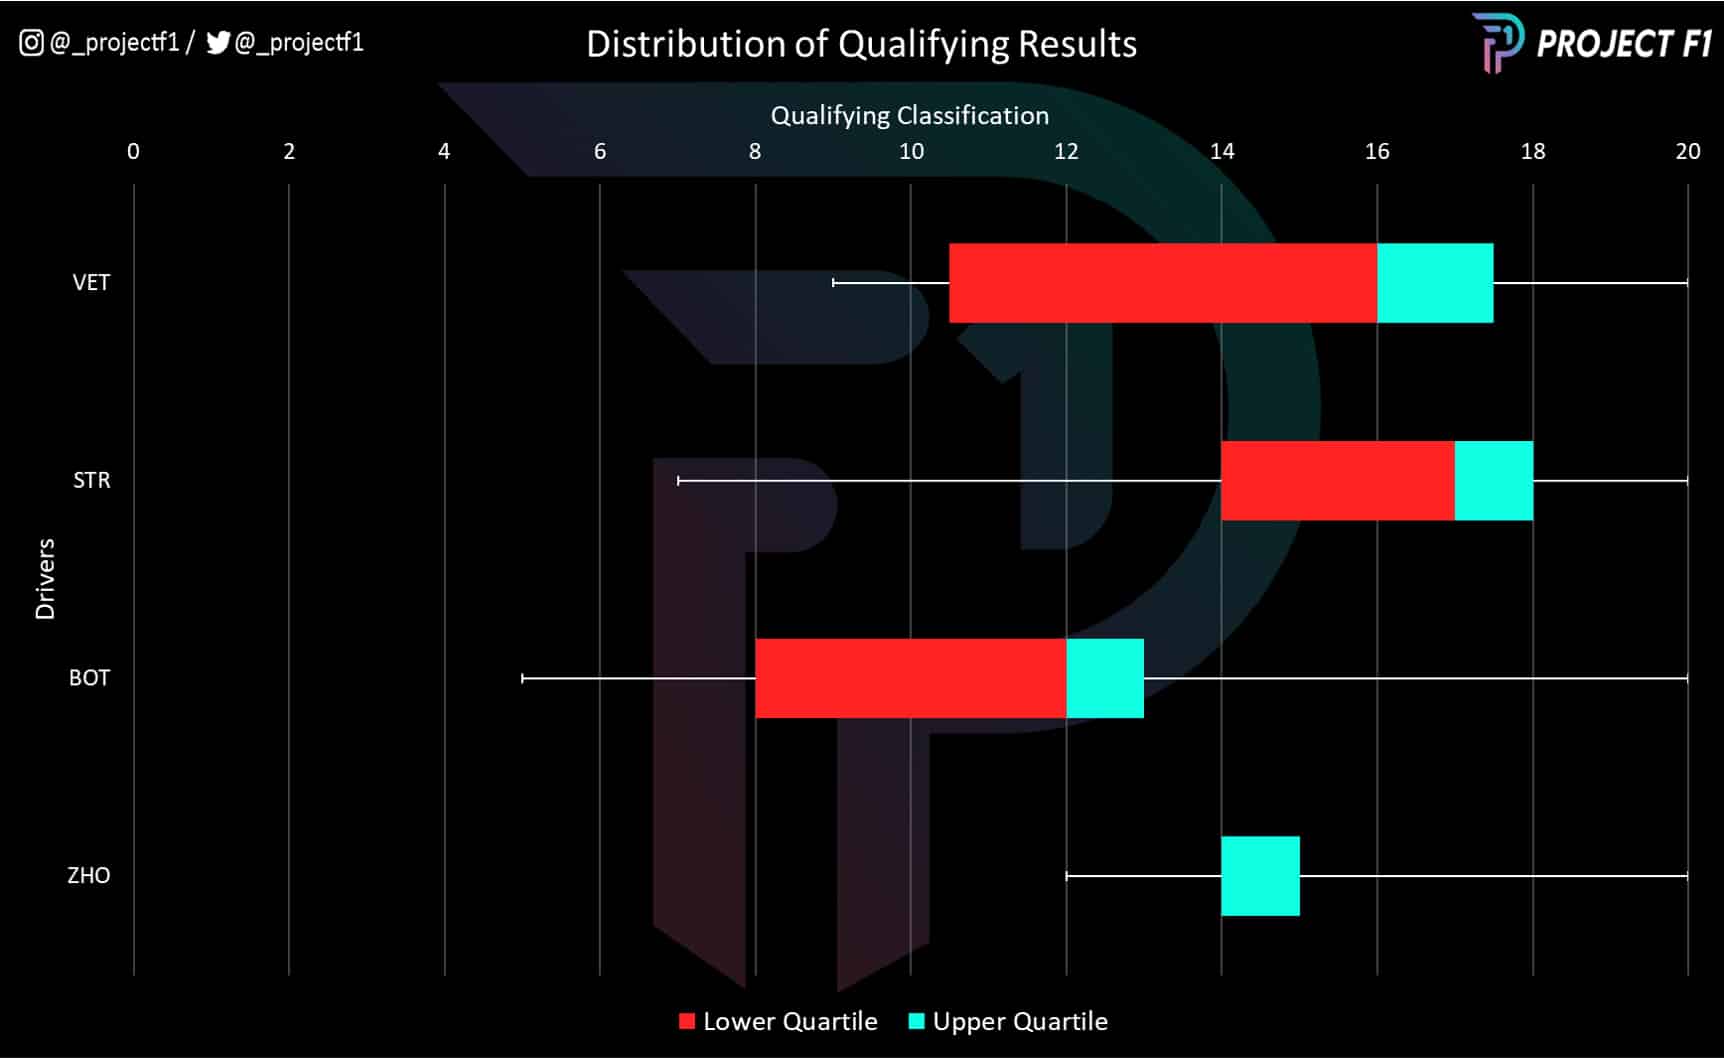
Chart 3 Qualifying results
Chart 3 examines each driver’s consistency in qualifying, once rain-affected sessions have been removed.
The white bars show the range of all qualifying results in 2022, while the red and blue bars represent the middle 50%, excluding outliers.
Bottas was the best qualifier by far, followed by his team-mate and the two Astons. Bottas was also the only driver whose lower quartile value was in the top 10 with a best qualifying of P5.
On a median basis both Alfas were making it into Q2 while the Astons were stuck in Q1. It seems clear that the Alfa was the better car in qualifying – which helped set up for stronger race performances while Aston was left having to compensate for its poorer grid positions.
Bottas blasts up the grid
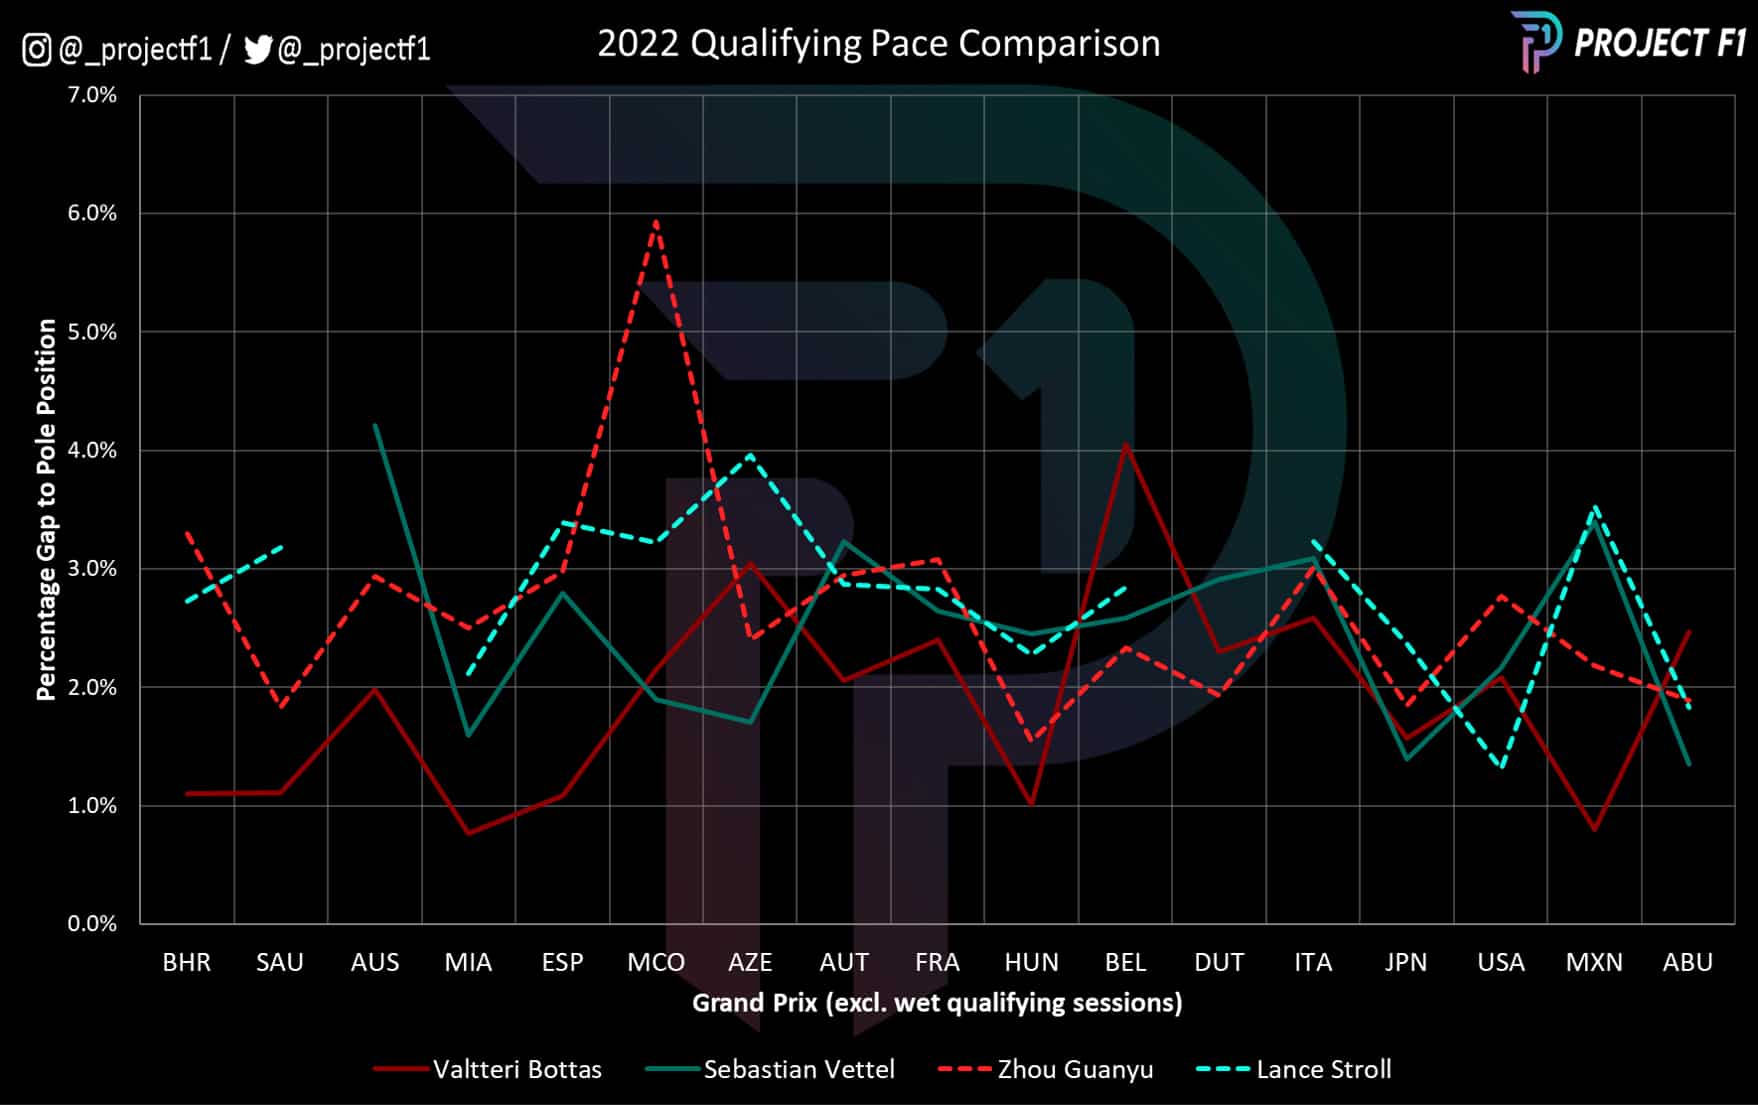
Chart 4 Qualifying pace comparison
In terms of all-out pace, Bottas had a strong start to 2022, comfortably ahead of the competition. This lasted well into the first half of the season after which Aston was able to find more pace and close the gap somewhat.
The same can be said for Zhou who started off with a large deficit to his team-mate but would find improvement and close the gap. It was a similar story for Stroll who, generally speaking, would trail his more experienced team-mate for much of the season while having a few standout performances.
Where Aston Martin made up ground
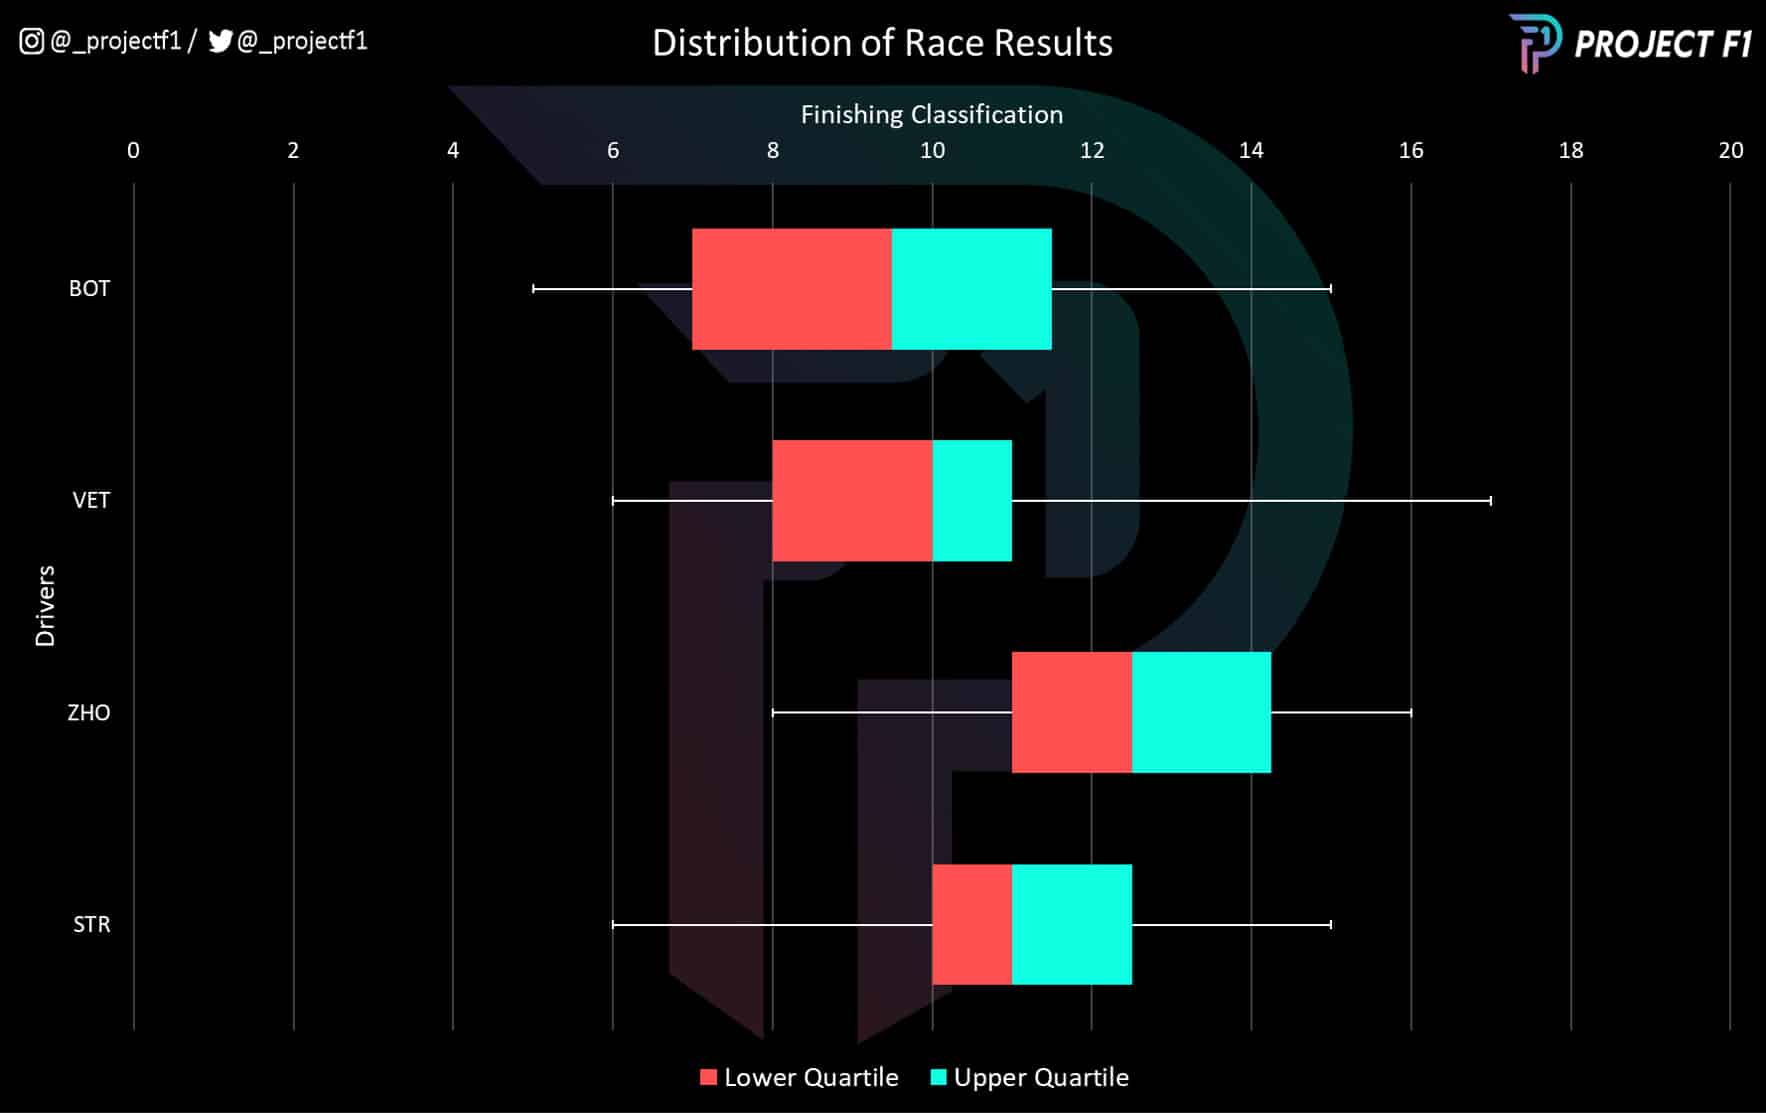
Chart 5 Race results
Chart 5 shows an interesting and stark contrast to its qualifying counterpart, Chart 3, shown earlier. Here there is much tighter dispersion in the outcomes among all four drivers. Bottas still leads the field in terms of median finish and best finish but is closely trailed by Vettel and then the two others.
On average (median), both Bottas and Vettel finished races within the points-paying positions while Stroll and Zhou did not.
Stroll at least had a lower-quartile value that was still within the points while Zhou’s interquartile range was outside of the top 10, which points to the rookie’s lack of consistency. However, Bottas’s performance was strong enough to compensate for this.
It’s an impressive showing for Aston, given the penalty it carried by starting lower down the order. The data shows how its race pace overcame that disadvantage to end up with race results that were similar to Alfa.
But this also goes to show the missed opportunity, had Aston been able to produce a better qualifying car. The likelihood is that it would have been able to convert the same race pace into more advantageous positions and points.
The drivers at the sharp end
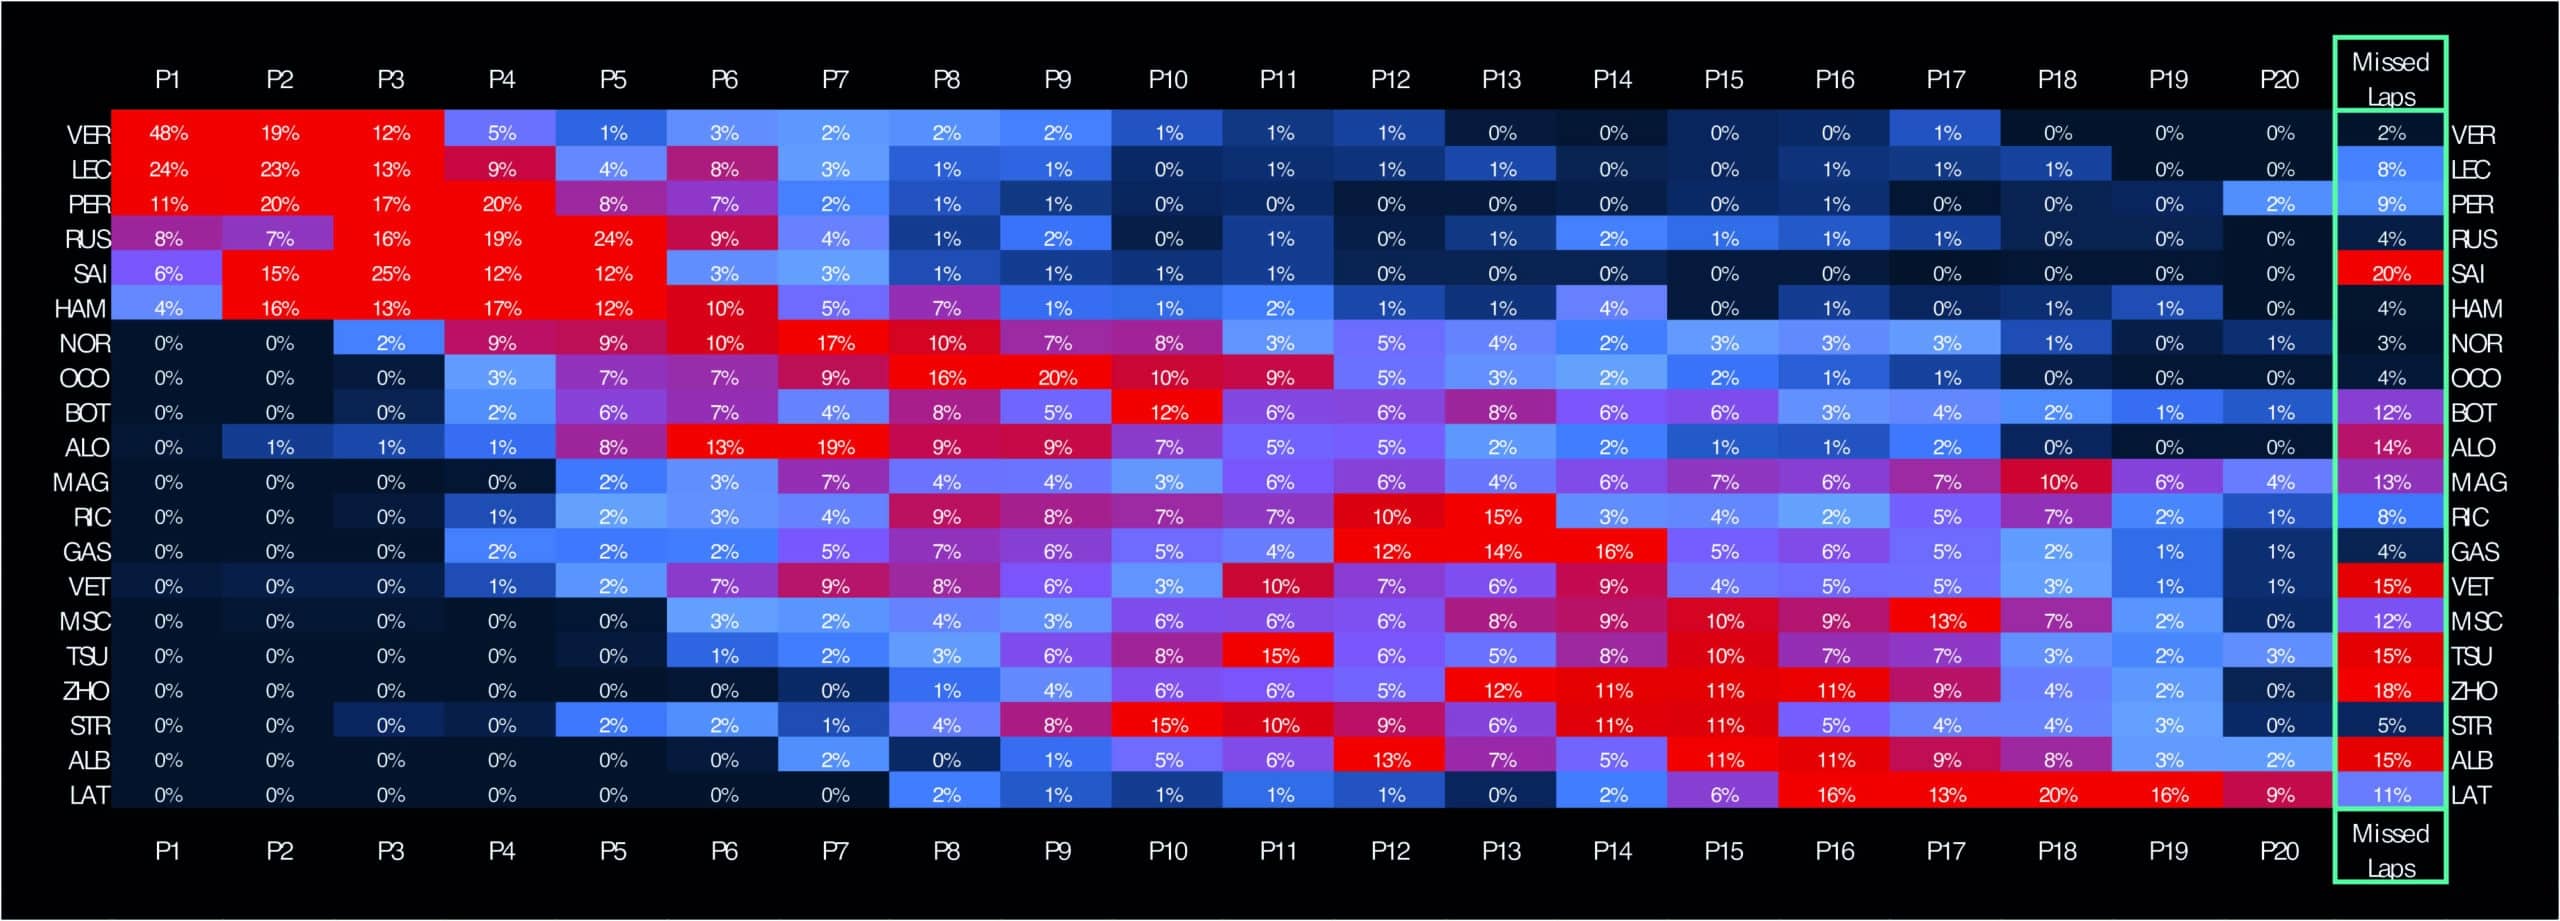
Chart 6 Laps in position
Chart 6 showcases the proportion of time each driver spends in each position, with red as high, fading to blue and then black as the proportion decreases.
The heatmaps show how Bottas is not only able to spend more time at the pointy end of the grid but also more time in the top 10. Add up the percentages and Bottas spends roughly 45% of the time in the top 10 followed by Vettel at 35%, Stroll at 33% and Zhou at 11%.
Although this means that Aston Martin spent about 34% of the time in the top 10 compared to Alfa Romeo’s 28%, the distribution of points meant that Alfa received a greater benefit from finishing in higher positions.
This is down to the fact that Bottas was nabbing more points on average compared to Stroll who, when he would place in the top 10, would often place toward the lower end instead. In short, Alfa Romeo benefitted from the skew of points despite having a greater proportion of missed laps over the course of the season, largely due to mechanical issues.
Vettel shows his speed
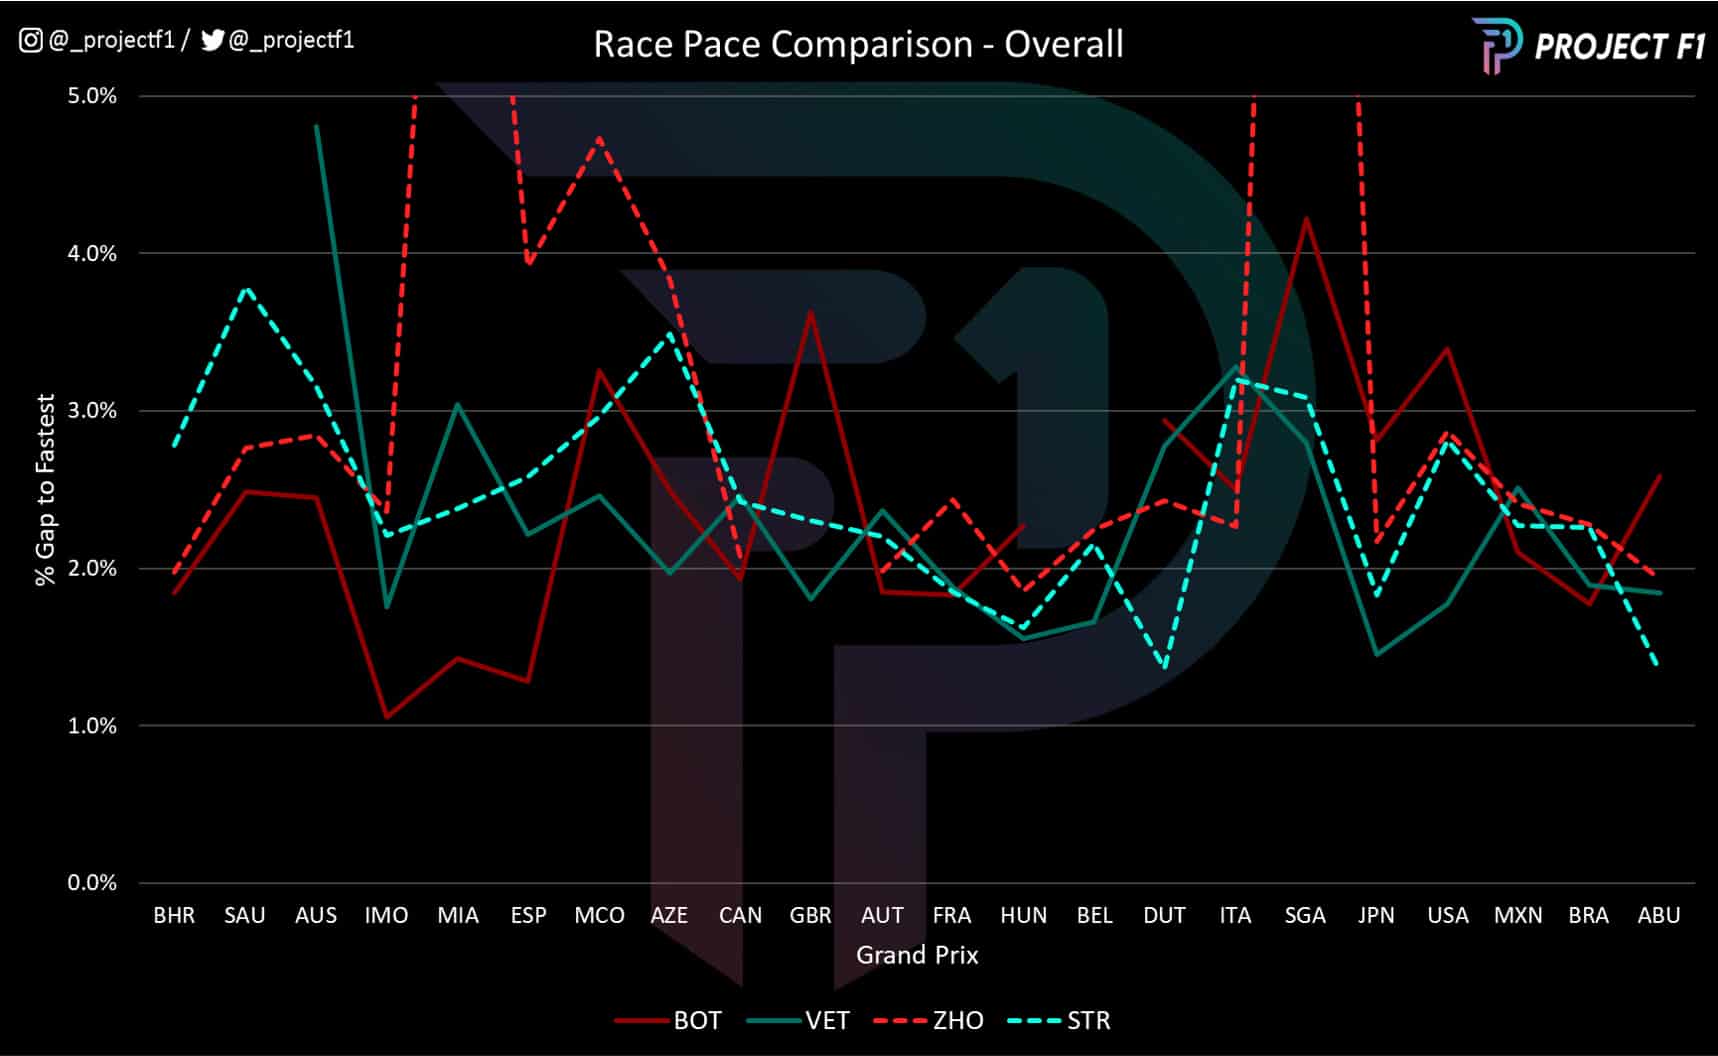
Chart 7 Race pace comparison
Chart 7 paints another interesting picture. Once again, Alfa Romeo (namely Bottas) and its early advantage shines through once again as it did in Chart 4. But there is also a stark difference in the pace differential to Aston Martin. Unlike Chart 4, Aston Martin actually had better race pace and this started much earlier than halfway through the season. From Monaco onwards it was common for Vettel to have better pace than either Alfa driver (with some exceptions).
This goes to show that Aston Martin likely had the better race car as the season went on. Aston’s profile over time also shows a slight improvement while Alfa’s trendline appears fairly stable. Furthermore, the pace differential between Vettel and Stroll is smaller than that of Bottas and Zhou.
When it came down to it, Aston lost sixth place in the championship over the closing laps of the Abu Dhabi Grand Prix: Sebastian Vettel, unable to pass Daniel Ricciardo in the all-important ninth place battle.
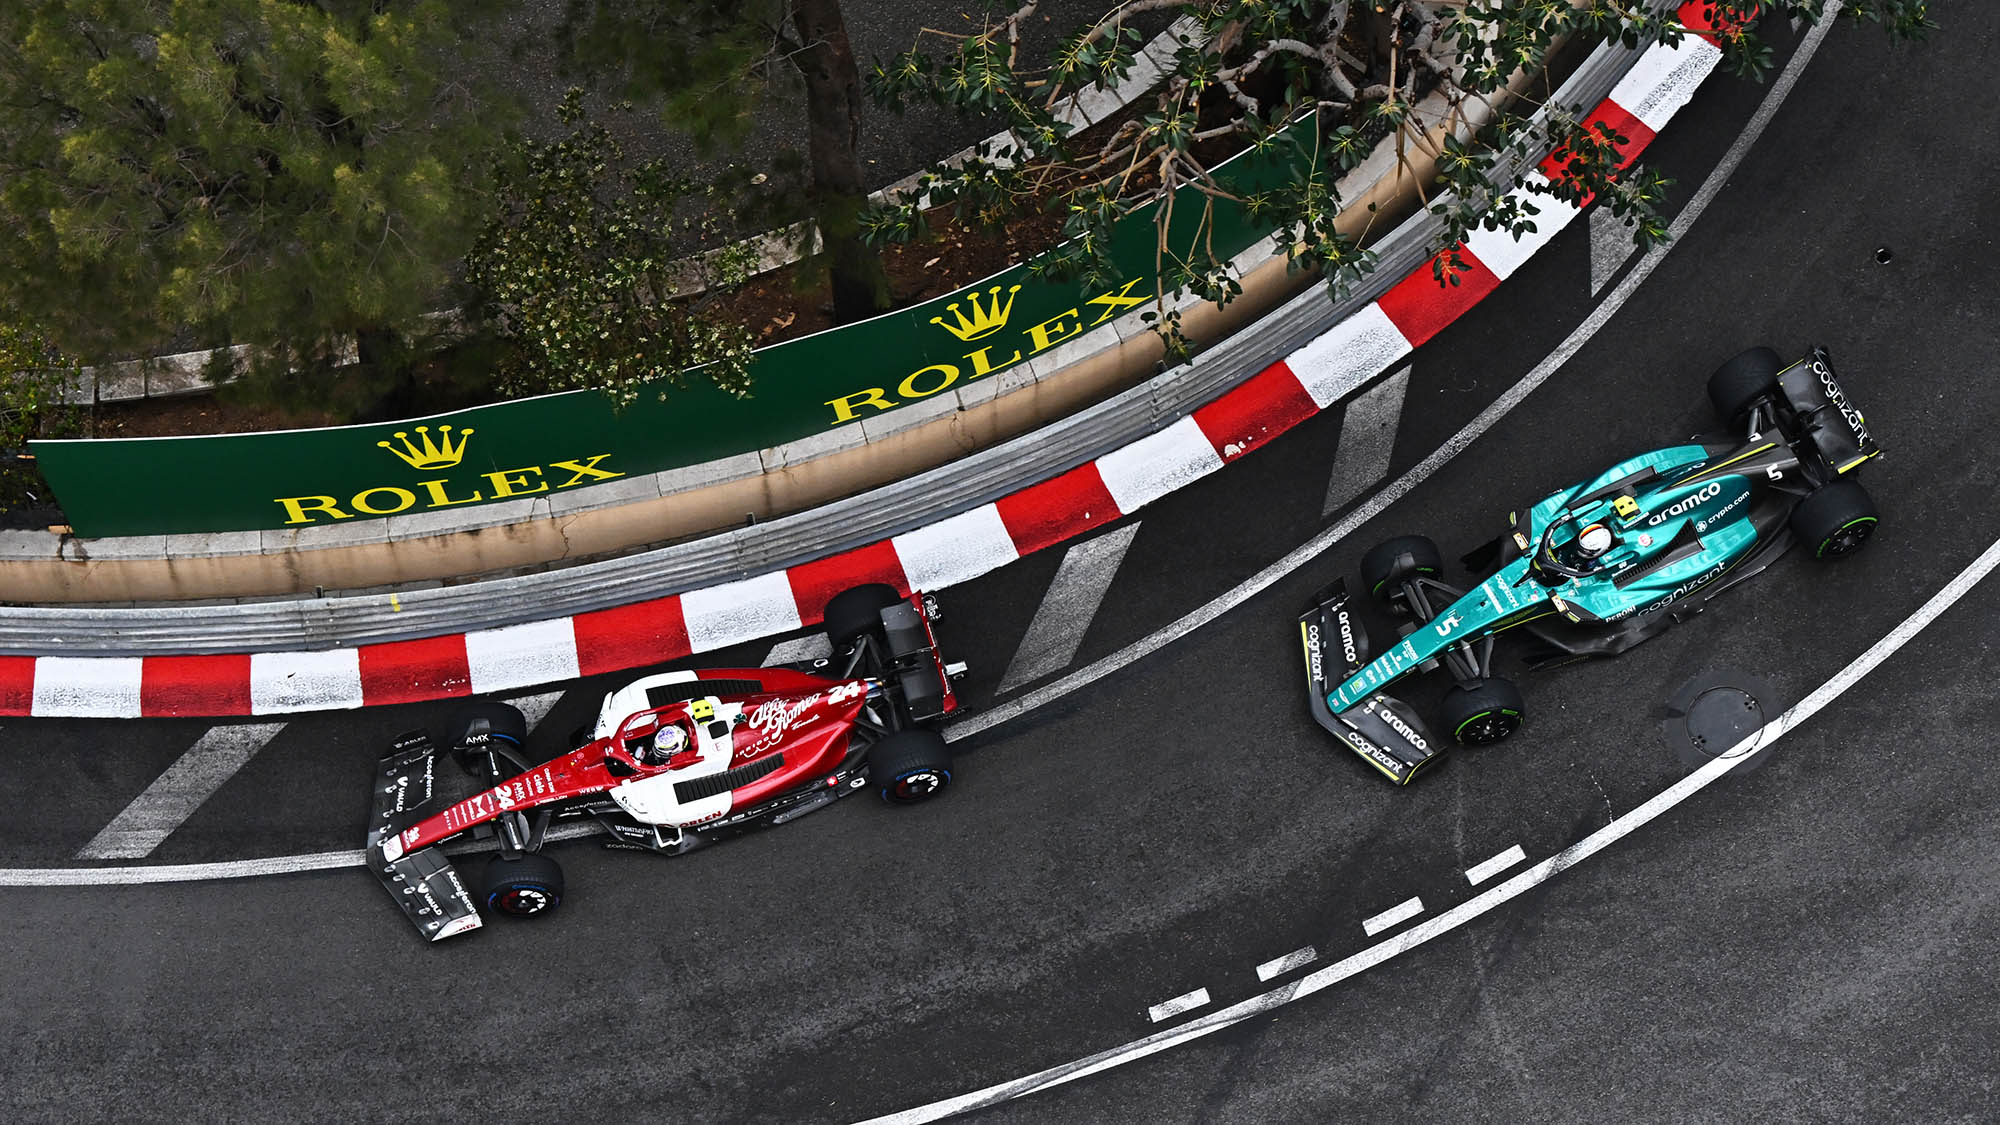
But in reality, the war was lost during qualifying, where Aston’s poorer pace consigned its drivers to largely compensatory drives.
Added to that, Alfa hit the ground running at the start of the season, capitalising on the woes of others (including Aston) to build an advantage that just held to the end of the year.
In its case, one star driver (Bottas) overcame a better driver pairing with a weak but improving car and odd strategy.
But there is plenty of Aston to build on as it contemplates the start of the 2023 season. At the beginning of last year, we weren’t even contemplating that it would challenge Alfa – it looked more likely to be fighting with Williams.
But by the season’s end it was one of the few battles that kept our attention, and for that Aston Martin did well to get back into it.
Project F1 turns data into graphics that uncover race pace and strategy
See more analysis at @_ProjectF1 on Twitter or @_ProjectF1 on Instagram
